GIS Projects 2019-2023
WELCOME
Welcome to my professional and scholarly portfolio which are selected Urban projects completed during my Graduate Certificate in Geographic Information Science and Technology which are related to urban and land-related projects, including wildlife preservation, urban health accessbility in Chicago , Study of urban metaphorisi in Atlanta, population density mapping, Hotspot analysis of human mobility during covid pandemic at Texas Tech University. These projects include Introduction to GIS, Advance GIS, Remote Sensing, Cartography, Spatial Analysis, GPS and Field Mapping

-
GPS Field Mapping
-
Story Map Creation
-
Spatial Analysis
-
Remote Sensing
-
Cartography
-
ArcGIS Online
-
ArcGIS Pro
-
Survey123
GIS Skills
Project | 01

Spring 2019 | Intro GIS Project
Buffalo Commons: A Proposal for Wildlife Preservation
Software: ArcMap(ArcGIS)
The Buffalo Commons movement seeks to revitalize the Great Plains culturally and socially, emphasizing regional sustainability and community rejuvenation. This study focuses on locating the best site for the Buffalo Commons project, which aims to conserve wildlife and breathe new life into the Great Plains. The project promises economic and ecological benefits by rejuvenating barren lands, attracting visitors, and serving as an educational platform for nature restoration. Buffalo Commons has the potential to create a significant, cost-effective impact on the Great Plains, offering substantial future returns both economically and socially. The project considered criteria like biodiversity and ecotourism, favored locations near accessible roads and capital cities, and maintained its budget at $7.5 billion.
Project | 02

Fall 2020 |ADV GIS project
Urban Health Accessibility
Software: ArcMap(ArcGIS)
Spatial Analysis
My Geodatabase (GDB) is designed to display urban health accessibility in Chicago. It maps the
population of neighborhood, block group, and census block accessibility to parks and hospitals.
The parks and hospitals are defined as urban health points. The urban health accessibility of three
population groups is stated as walking or driving distance in the designated quarter mile or 10
minutes walking distance buffer of hospitals and parks. The Urban Health Accessibility GDB will
measure population coverage inside the urban health buffers
Project | 03

Fall 2020 |Remote Sensing of Environment
Study of Metamorphosis of Urban Morphology in Atlanta
Software: ENVI
land use and land cover mapping
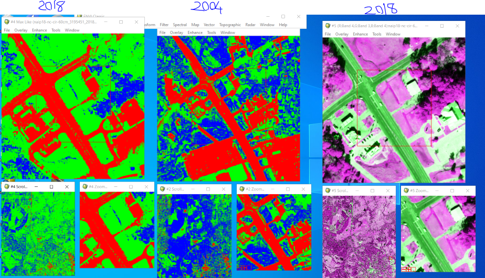
The project aimed to investigate urban sprawl between 2004 and 2018, assessing changes in urban density and the transformation of non-urban areas into either low or high urban density. Using 60cm resolution NAIP imagery (NAIP18 and NAIP04), Maximum Likelihood classification was employed for precise analysis. A false color image (R: band1, G: band2, B: band1 for 2004 and R: band4, G: band3, B: band4 for 2018) was used in ENVI to enhance data interpretation. Results showed a shift from non-urban to low urban density and an increase in urban development, indicating an overall urban density increase, illustrated by a false color image of Houston county from 2004 to 2018.

Project | 04
Spring 2022 | Cartography
Software: ArcGIS Online
Top counties with the highest population in Texas
we're employing spatial analysis and GIS techniques to chart the top ten Texas counties with the highest population density. These counties, which include Dallas, Harris, Tarrant, Bexar, Travis, Collin, El Paso, Denton, Fort Bend, and Galveston, were chosen due to their significant population density. This analysis informs strategic urban planning and professional decision-making.

Project | 05
Spring 2022 | Spatial Analysis
Software: ArcGIS Online
Top admission rate among Texas universities
Spatial Analaysis of showing the highest admisison rate in university located in TexasThrough spatial analysis, we aim to identify the Texas university with the highest admission rate, which is Wayland Baptist University. This analysis involves assessing the geographic distribution of universities and their respective admission rates, offering insights into regional admission dynamics.
Project | 06
Spring 2022 | Spatial Analysis
Software: ArcGIS Online
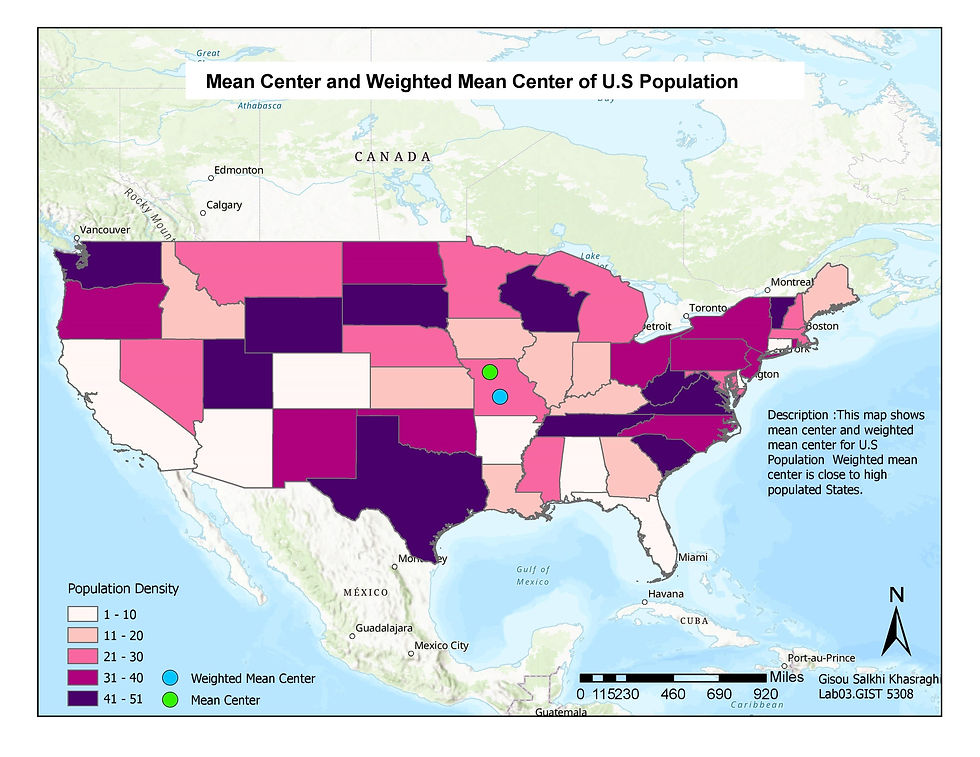
The map visually represents the geographic location where the average population center and the weighted average population center are situated within the United States. The mean center represents the average point where the entire population is centered, while the weighted mean center considers the population's distribution and density, giving more significance to densely populated areas.

Project | 05
Spring 2022 | Spatial Analysis
Sidewalk Connectivity Map of Texas Tech Campus
Unit Tutor: Dr.Xiao-Peng Song
I'm a Paragraph. Click here to add your own text and edit me. It’s easy. Just click “Edit Text” or double click me and you can start adding your own content and make changes to the font. Feel free to drag and drop me anywhere you like on your page. I’m a great place for you to write more. Tell a story about yourself.
Project | 06
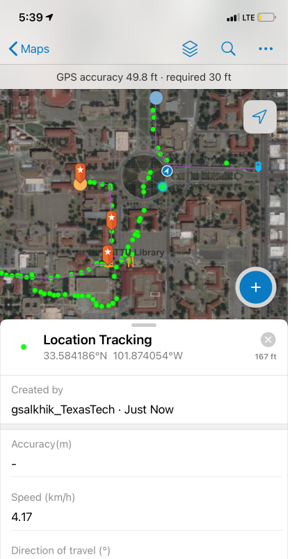


Fall 2020 |GPS Field Mapping
Campus Walkability Web App
My Geodatabase (GDB) is designed to display urban health accessibility in Chicago. It maps the
population of neighborhood, block group, and census block accessibility to parks and hospitals.
The parks and hospitals are defined as urban health points. The urban health accessibility of three
population groups is stated as walking or driving distance in the designated quarter mile or 10
minutes walking distance buffer of hospitals and parks. The Urban Health Accessibility GDB will
measure population coverage inside the urban health buffers
Project | 05


2022 Fall |Cartography & Geovisualization| Analysis of Mobility
Mobility in Lubbock During Pandemic
The research focuses on human movement in geography, particularly during the COVID-19 pandemic. Lockdowns and social distancing measures limited mobility but some areas still had more movement. The study aims to identify peak mobility areas in Lubbock, Texas, by analyzing 2021 mobility data using ArcGIS. It also examines how urban facilities are distributed among different social groups and how this relates to spatial inequality. Preliminary findings reveal uneven access to services, highlighting the need for planners and policymakers to ensure equal distribution of urban facilities to align with human rights and Sustainable Development Goals (SDGs).

Project | 06